The Real Global Warming Signal
By Tamino
Open Mind
Many different factors affect Global temperature. Fake “skeptics” like to claim that mainstream climate scientists ignore everything but greenhouse gases like CO2, when in fact it’s mainstream climate scientists who identified those other influences.
Natural factors cause temperature fluctuations which make the man-made global warming signal less clear, fluctuations which are often exploited by fake skeptics to suggest that global warming has paused, or slowed down, or isn’t happening at all.
A new paper by Foster & Rahmstorf accounts for some of those other factors, and by removing their influence from the temperature record makes the progress of global warming much more clear.
The paper studies the five most often-used global temperature records.
- Three of them are surface temperature estimates, from NASA GISS, HadCRU, and NCDC.
- The other two are satellite-based lower-atmosphere estimates from NASA GISS, HadCRU, and NCDC.
These are compared to three factors which are known to affect climate:
- The el Nino southern oscillation,
- Atmospheric aerosols (mostly from volcanic eruptions), and
- Variations in the output of the sun.
The time span studied was from January 1979 through December 2010, for which all five data sets have complete coverage.
The impact of el Nino is characterized by the Multivariate el Nino index (MEI), that of volcanic aerosols by Aerosol Optical Depth (AOD), and solar output by Total Solar Irradiance (TSI).
Their influence was estimated by multiple regression. In addition to these natural influences the regression also included a linear trend in time, allowing a simultaneous estimate of the rate of global warming as well as the impact of these other factors. Since the natural influences can have a delayed effect on temperature, the regression allowed for a lag between the value of any of the three factors and its impact. Once the effect of the three known factors was estimated, it could be removed from the temperature data to create adjusted temperature data which is mostly (but not completely!) free of their influence.
The raw data — before the natural fluctuations are removed — look like this:
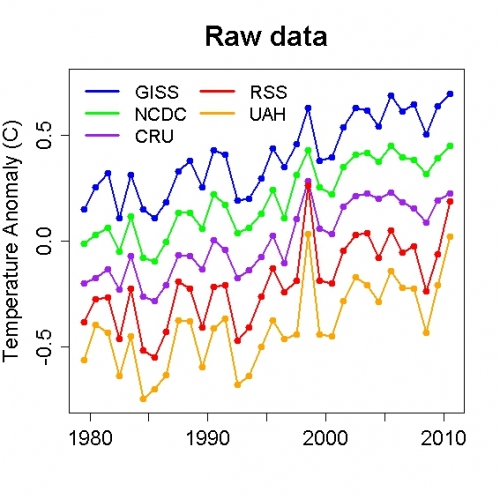 All five records show similar changes, including an upward trend over the 32 years studied. They also show large fluctuations, more so for the satellite data than the surface data. This has spurred numerous false claims of silly things like “global warming stopped in 1998 (due to the large spike from the powerful el Nino of that year). Large fluctuations also make it more difficult to establish the statistical significance of trend, leading to meaningless statements about “no statistically significant warming for 15 years” (or 10 years, or 7, or since last Thursday).
After the natural influences are removed, the adjusted data look like this:
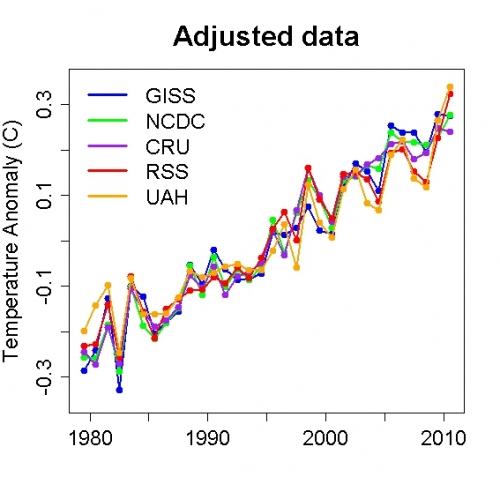 With the bulk of the fluctuations removed, the continued course of warming over the entire time span (including the last decade) is undeniable. It’s worth noting that in all five adjusted data sets, the last two years (2009 and 2010) are the two hottest.
With much of the natural fluctuation removed, it’s possible to compute trends more precisely. Hence it’s interesting to consider whether the trend due to global warming has changed during this interval.
To that end, trend rates were estimated (along with uncertainties) for a variety of time intervals, starting with all years from 1979 through 2005 and ending with 2010 (error bars are plus-or-minus 2 standard errors):
 None of the data sets shows any evidence that the global warming rate has changed recently. A truly fascinating result is that increased precision enables us to establish the statistical significance of a warming trend using a shorter time span than with unadjusted data. All five data sets show statistically significant warming since 2000.
Another interesting result is that el Nino and volcanic aerosols have a stronger influence on lower-atmosphere temperature (from satellite measurements) than on surface temperature (the plot shows the negative of the coefficient for aerosols, so that for all three factors higher values indicate stronger influence, with black dots for global temperature, red for the northern hemisphere, and blue for the southern hemisphere):
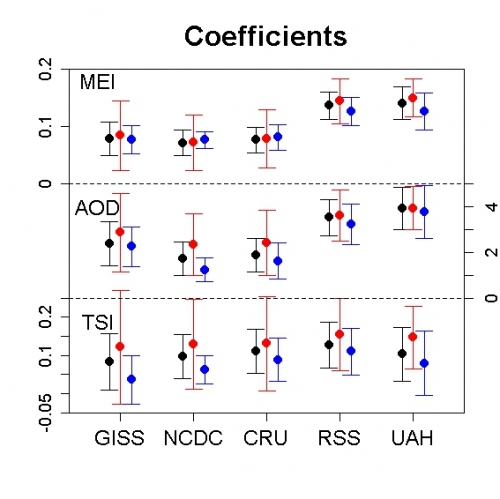 That’s one of the reasons that the satellite data show more natural variation than surface data, as well as greater uncertainty in trend estimates when the known factors are not removed. After removing the influence of known factors, uncertainty levels in trend estimates using surface and satellite data are comparable (again, black dots are for the globe, red for the northern hemisphere, blue for the southern hemisphere):
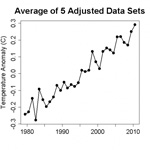
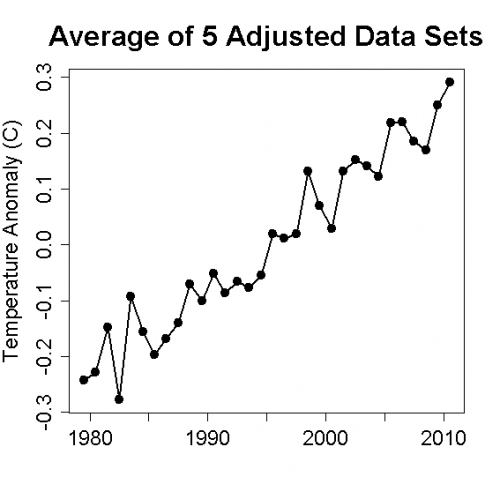
 We can even average the five adjusted data sets, giving this:
This shows, with great clarity and impact, the real global warming signal.
And, it should put an end to real skeptics claiming that global warming has recently stopped or slowed down, because real skeptics base their beliefs on evidence.
I don’t expect it will have much effect on the behavior of fake skeptics.
Source: Open Mind



Comments
The Real Global Warming Signal — No Comments